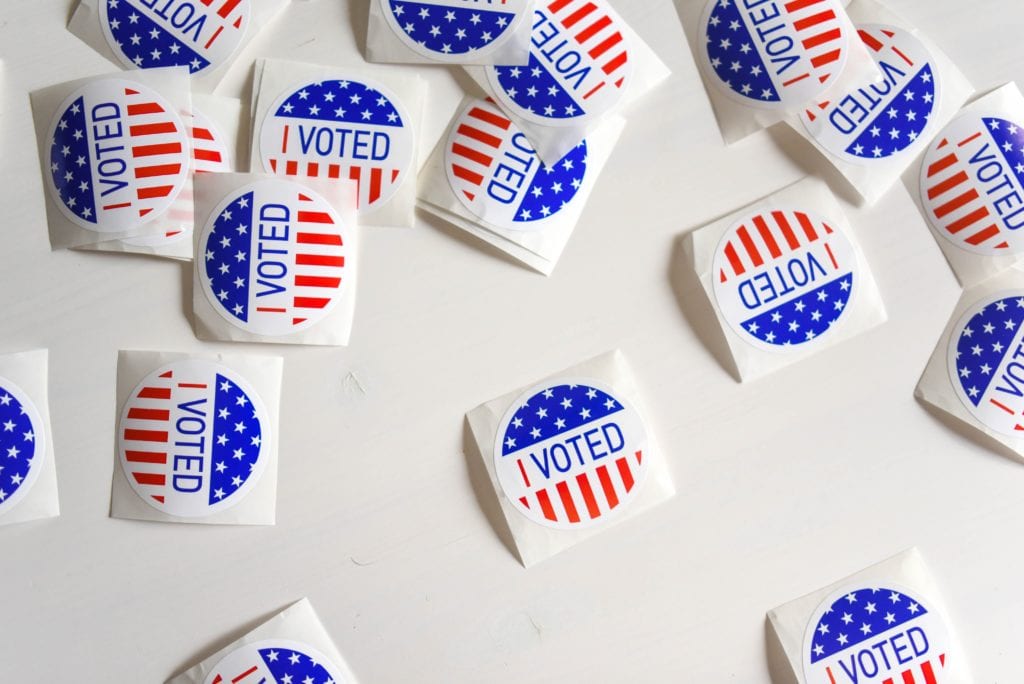
The 2020 presidential election is just under a year away, and our divided populace is showing bipartisan support on one related topic:
They’re worried about the role technology may play in altering or negatively impacting election results.

This is no surprise given Americans’ serious concerns about data privacy and security that consumers (and a subset we’re calling Techruptors) expressed in Ketchum’s 2019 Social Permission and Technology study1, which we unveiled last week.
Included in that survey were results we’re sharing today about respondents’ growing fears that technology will play a nefarious role in the presidential race, as well as other elections and initiatives that could have a disruptive effect on our democracy.
Consider these eye-opening findings. A decisive majority of consumers are worried about:
- Foreign interference in the election, using technology (63%)
- Technology issues with voter databases (60%)
- Issues with voting machines (59%)
- The influence of social media on the race (61%)
Further, nearly half (48%) feel worse about the political use of social media than they did a year earlier.
This level of distrust – shared at varying but similarly lofty levels by both liberals and conservatives – is alarming. And it should give pause…
These results stimulate a whirlwind of questions. For instance, will this lack of faith in technology create even more political division and less belief in final outcomes than what we’re currently experiencing as a nation? Will the voters blame technology brands for misinformation or results they think are manipulated?
Time will tell on that topic. But the survey results revealed that consumers are not sitting idly by, hoping that everything will turn out fine. They’re taking action.
A large proportion of consumers who are worried about the influence of social media in relation to the 2020 American presidential election have changed their behaviors related to technology, with 66% deleting apps from their phone; 52% creating or using more complex passwords; and 47% turning off location tracking.
Furthermore, more than a third (38%) of consumers who self-identify as concerned about the influence of social media in relation to the 2020 election are choosing to use social accounts less frequently. And that, potentially, can hit social-reliant brands right where it hurts: in the pocketbook. One presumes these actions are, in part at least, driven by concerns their political views will somehow be manipulated.
Also, nearly nine in 10 (89%) believe there needs to be more legislation around data privacy and that companies should be fined if data breaches occur on their watch. Perhaps relatedly, a majority (59%) believe that large technology companies should be broken up.
As with the discord consumers are having with technology in general, their concerns about its impact on the forthcoming election can have dramatic implications for business communications and democracy itself. We anticipate more pushes for stronger government regulation, as well as calls for companies to self-police data privacy much more rigorously. There will be more questions about how technology can manipulate the public – from algorithms for search engines to rules governing issues advertising on social media platforms.
Many technology companies and providers face the consequences of eroding reputations and, ultimately, corporate viability.
An overstatement? We don’t think so. Americans of all political persuasions are caught in a love-hate relationship with technology, with concerns growing in popularity and influence.
Our Ketchum team stands ready to share further details from the 2019 Social Permission and Technology study, as these findings can have a major impact on corporate and political communications for many years to come.
###
1 Ketchum’s Analytics team conducted the second annual Social Permission and Technology Study, an online omnibus survey of 1,022 adults age 18+ in the United States, between August 20, 2019 and August 23, 2019. When necessary, the data was weighted to be nationally representative of the U.S. population as it relates to age, gender, region, race/ethnicity, education and income. The margin of error for the total sample is +/-3.1 percentage points at the 95 percent confidence level. Smaller subgroups will have larger error margins.


